
Millions of websites currently rely on Google Analytics data to monitor how their website is performing and how effective SEO services and content marketing strategy is working, as well as a myriad of other important information about how people use their website. As a result of the arrival of GA4 (and the sunsetting of Universal Analytics), the way we do things needs to change.
While GA4 first launched in October 2020, Google has been warning us since early 2022 that Universal Analytics (UA) will stop processing data by July 2023 and encouraging every website owner or administrator to set up GA4 properties in the meantime. While many will have done this, whilst leaving their existing UA properties running alongside, actually starting to use GA4 and changing the way you report according to the data it provides is another matter.
GA4 works very differently from UA, both in the data capture in the first place and the UI that users navigate around to access the information. We won’t go into great detail about this here, but our previous blog on why to migrate to GA4 ASAP could be useful if you want to know more about the main differences and read some migration tips.
In this blog, we cover some important SEO metrics and reports that many marketers currently use in UA that are different in GA4, and explain how to ensure you can access the data you want in GA4 to be able to accurately measure and report on it from July 2023 onwards.
SEO metrics that measure user engagement in GA4
GA4 is markedly different from UA in many of the ways it captures and reports on data. This means that reports you may have been relying on for years will need to change when using GA4. Confusingly, some of the terminology used in GA4 is the same, but has a different meaning now to what you may be used to in UA.
User engagement is front and centre to SEO reporting, because it’s not enough to just know that organic traffic has been driven to your website; you need to know that the organic traffic landing is relevant to your business and how they engage with your content and site provides important information on things like your keyword strategy, content performance and UX.
We’ve outlined some of the essential SEO metrics and reporting features that help quantify and illustrate organic performance and user engagement in GA4.
Find GA4 traffic source data
It’s always important to have a clear picture of the digital channels that are driving people to your website and increases in organic visits over time is a good indication that your SEO strategy is having an impact. GA4 provides acquisition data by both session and user. This can be found under the reports section. Life cycle > Acquisition > Traffic Acquisition.
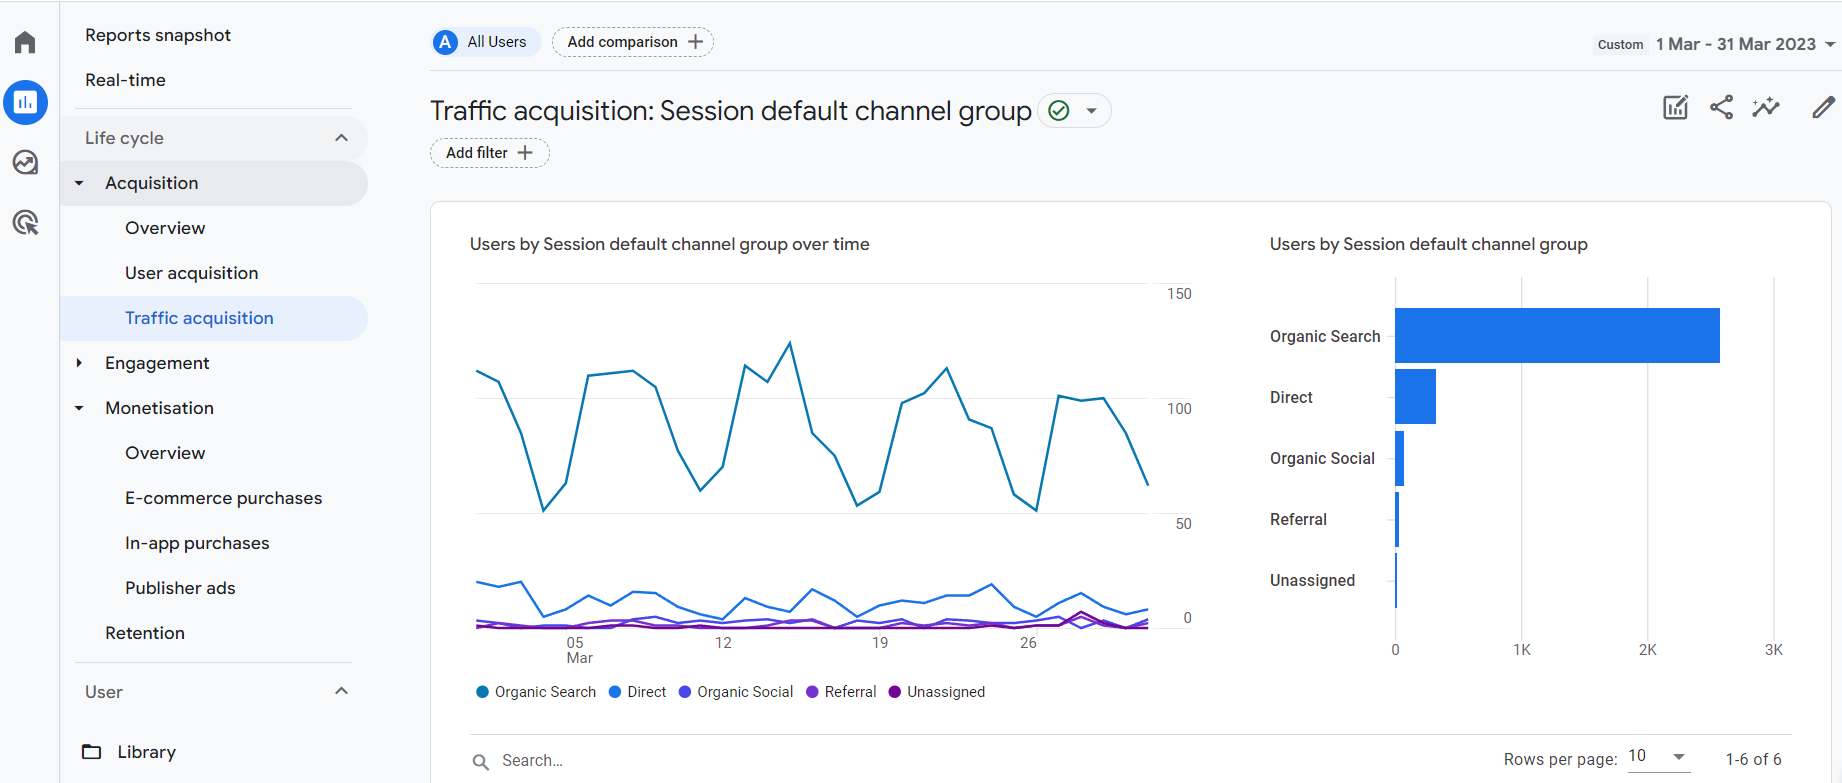
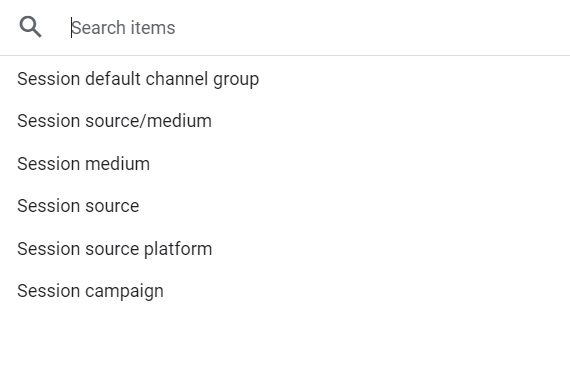
By default, this is sorted into channel groupings, but this can be tweaked according to your preference. For example, clicking on the dropdown below the search bar, at the top of the data table, will give you the option to change the view to something such as source/medium if that is more useful for you.
You can also view additional dimensions, including custom dimensions, and can filter the report just for organic search if that’s the channel and data you’re focusing on.
Find GA4 bounce rate data
In the context of GA4, the way that bounce rate is measured is different to how it is in UA. In UA, bounce rate refers to the percentage of sessions that only take in a single page view on your website. Anyone who views just one page and leaves the site is considered a bounce and that number of bounces is divided by the number of total sessions to produce the bounce rate.
In GA4, bounce rate is calculated by the absence of ‘engagement’, rather than simply a session ending without viewing more than one page. In GA4, an engaged session is measured by one or more of the below criteria being met:
- Session lasts longer than 10 seconds
- Session triggered a conversion event
- User viewed two or more pages during the session
Therefore, a bounce in GA4 is a user session that lasts less than 10 seconds OR doesn’t trigger a conversion event OR doesn’t include two or more pageviews.
This change helps to negate an issue with bounce rate in UA, where a user could find all the answers they needed on a single page of the website, stay on that page for ages before leaving and they would be considered to have bounced, whereas they were actually really engaged with what they landed on.
The upshot of this is that bounce rate in UA can’t be compared to bounce rate in GA4 so any reporting you do using this metric will need to be adjusted. For example, looking at the same blog post through both UA and GA4 will give you very different bounce rate figures. On the No Brainer website, measured across last month, the same blog post shows a bounce rate of 95.3% in UA (i.e. very high) but a bounce rate of 53.6% in GA4. Instead of thinking that only around 5% of visitors were engaged with that page, GA4 tells us that actually around 46% were engaged with it, which can be a more useful way of assessing performance.
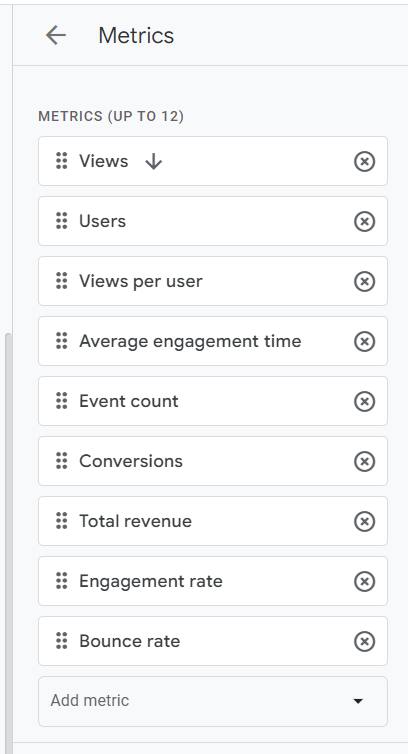
Bounce rate isn’t shown by default in GA4 when first set up, but can easily be added to any report by an admin on the analytics account. This is done by customising the report (pencil icon at top right of page), clicking on Metrics and then ‘add metric’ and searching for bounce rate. Up to 12 metrics can be added to a report.
Find search console data in GA4
Having Google Search Console (GSC) data integrated with analytics is very useful in UA and that doesn’t change with the switch to GA4. It means that you don’t have to do as much tab-switching and can find essential information all within the GA4 interface. Two reports are generated in GA4 when the GSC integration has been done and they can be accessed from the reports tab.
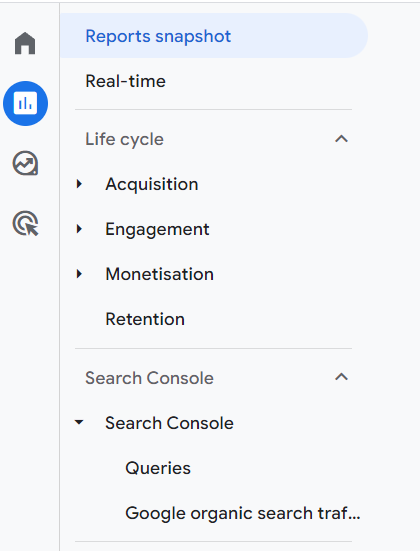
The Queries report shows impressions, clicks, CTR and average search position by specific keywords, the Google organic search traffic report shows the same information per URL of your website. While you’ll probably still need to access GSC separately at times, this snapshot pulled into GA4 can be helpful, especially if you add a secondary dimension to further filter the data to gain more granular insights, such as the devices used by searchers.
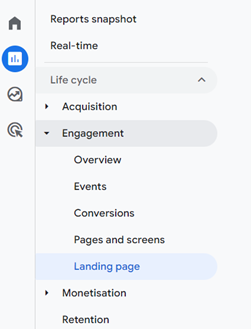
Find landing page report in GA4
There is a default landing page report in GA4 that sits under the engagement section of the reports tab.
However, you might find it more useful to customise this, or even create a new separate version just for organic reporting. If you find yourself wanting to view just organic data regularly in UA as things stand, it’s likely that you’ll benefit from having a separate report to do so in GA4 for this.
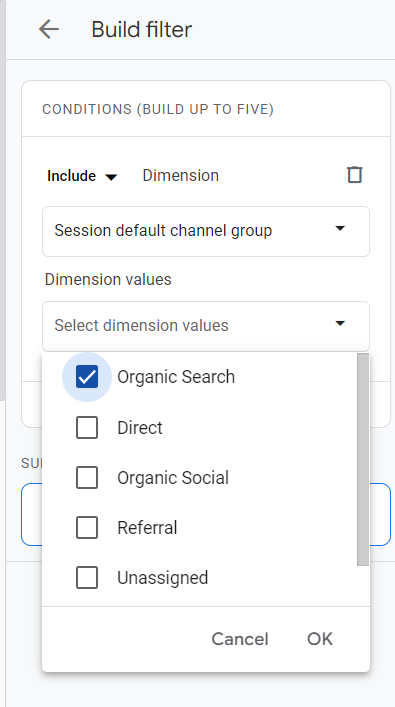
By customising the report (pencil icon in top right) and clicking on Filter, you can include only organic search traffic by using the session default channel group dimension.
Tweaking the metrics shown in this report (in the same way as shown with bounce rate earlier in the blog) means you can tailor it to show exactly what you need at a glance. Engagement rate is a must, and looking at conversions can help illustrate the value of a specific page to the business. Comparing a page with multiple conversions with other pages of a similar type that don’t appear to be working as well can also help highlight tweaks you can make.
Find GA4 conversions by page
Being able to track the number of goals achieved by a specific page on your website can be a great performance indicator and is one way you can attribute value to your SEO activity, when you filter data by traffic source. The ‘goals’ from older versions of analytics are no more, with ‘conversions’ being the term used in GA4.
Conversions that have been set up already can be viewed under the Engagement section of reports and you can have up to 30 conversions per GA4 property. They need to be configured in a different way to ‘goals’ and are essentially a measurement of specific ‘events’ that users trigger by a specific action they take on your website.
Turning an existing event into a conversion is fairly straightforward but the conversion data only starts being collected from the point that you toggle it on as a conversion. Go to Admin > Events to see what you have set up already, although it’s likely that you’ll want to set up some custom events that help measure SEO performance and value to the business specifically. This will depend on the nature of your business and what drives your revenue.
For ecommerce brands, as well as tracking individual sales and the revenue generated, you might also want to create events for things that bring a different type of value too, such as newsletter sign-up to bring people back to the site to convert at a later date.
For businesses that gain revenue from lead generation through the website, there can be a number of different events worth tracking and turning into conversions, such as when users fill out enquiry forms, complete newsletter sign-ups, download an eBook or guide etc. Google has lots of advice on how to set these up.
In terms of how to find the number of conversions by page in GA4, this is a field you can easily include in any page-based report in GA4, such as the landing page report mentioned earlier, by adding this metric to the table of data. By default, all conversions are shown in a combined figure, but you can easily change this to show any of particular interest, figure by clicking on the dropdown in the table column, as you can with goals in UA.
Short-term pain for long-term gain in GA4
There is no doubt that moving across to GA4 and starting to use it in place of UA is a bit of a learning curve. There are lots of differences and the new UI can be quite tricky to get the hang of, just to try and find data that you know must be there somewhere.
However, spending a little time getting accustomed to things now and ensuring the set up is done properly will pay off down the line. Taking some time to work out exactly which SEO metrics with tell you how well your strategy is performing and customising your GA4 reports to reflect this will make the whole process of reporting and checking things at a glance much easier in the future.
If you already use Google’s Looker Studio (formerly called Data Studio) for reporting, which pulls analytics information automatically through to custom dashboards that relate specifically to your marketing objectives, this will also need to be updated to ensure that the GA4 data that populates it is set up correctly.
If you are looking for some support with your SEO and/or content strategy, we’d love to chat with you about it. Get in touch using the form below.